Michelle from Fabulous in First is hosting today's chapter about Graphic Organizers.
I know graphic organizers are important because they help students visually organize information, and the Ms. Tate reinforced this concept citing that both left and right-brained students can benefit from graphic organizers. As a third grade teacher, I used and encouraged students to use organizers quite a bit, but for some reason in kindergarten I don't seem to use them as much.
I've used Venn Diagrams occasionally when comparing stories and have used webs when doing research with students. When I read that all students can benefit from the use of graphic organizers, I knew it was important to make more of an effort to incorporate them in our classroom.
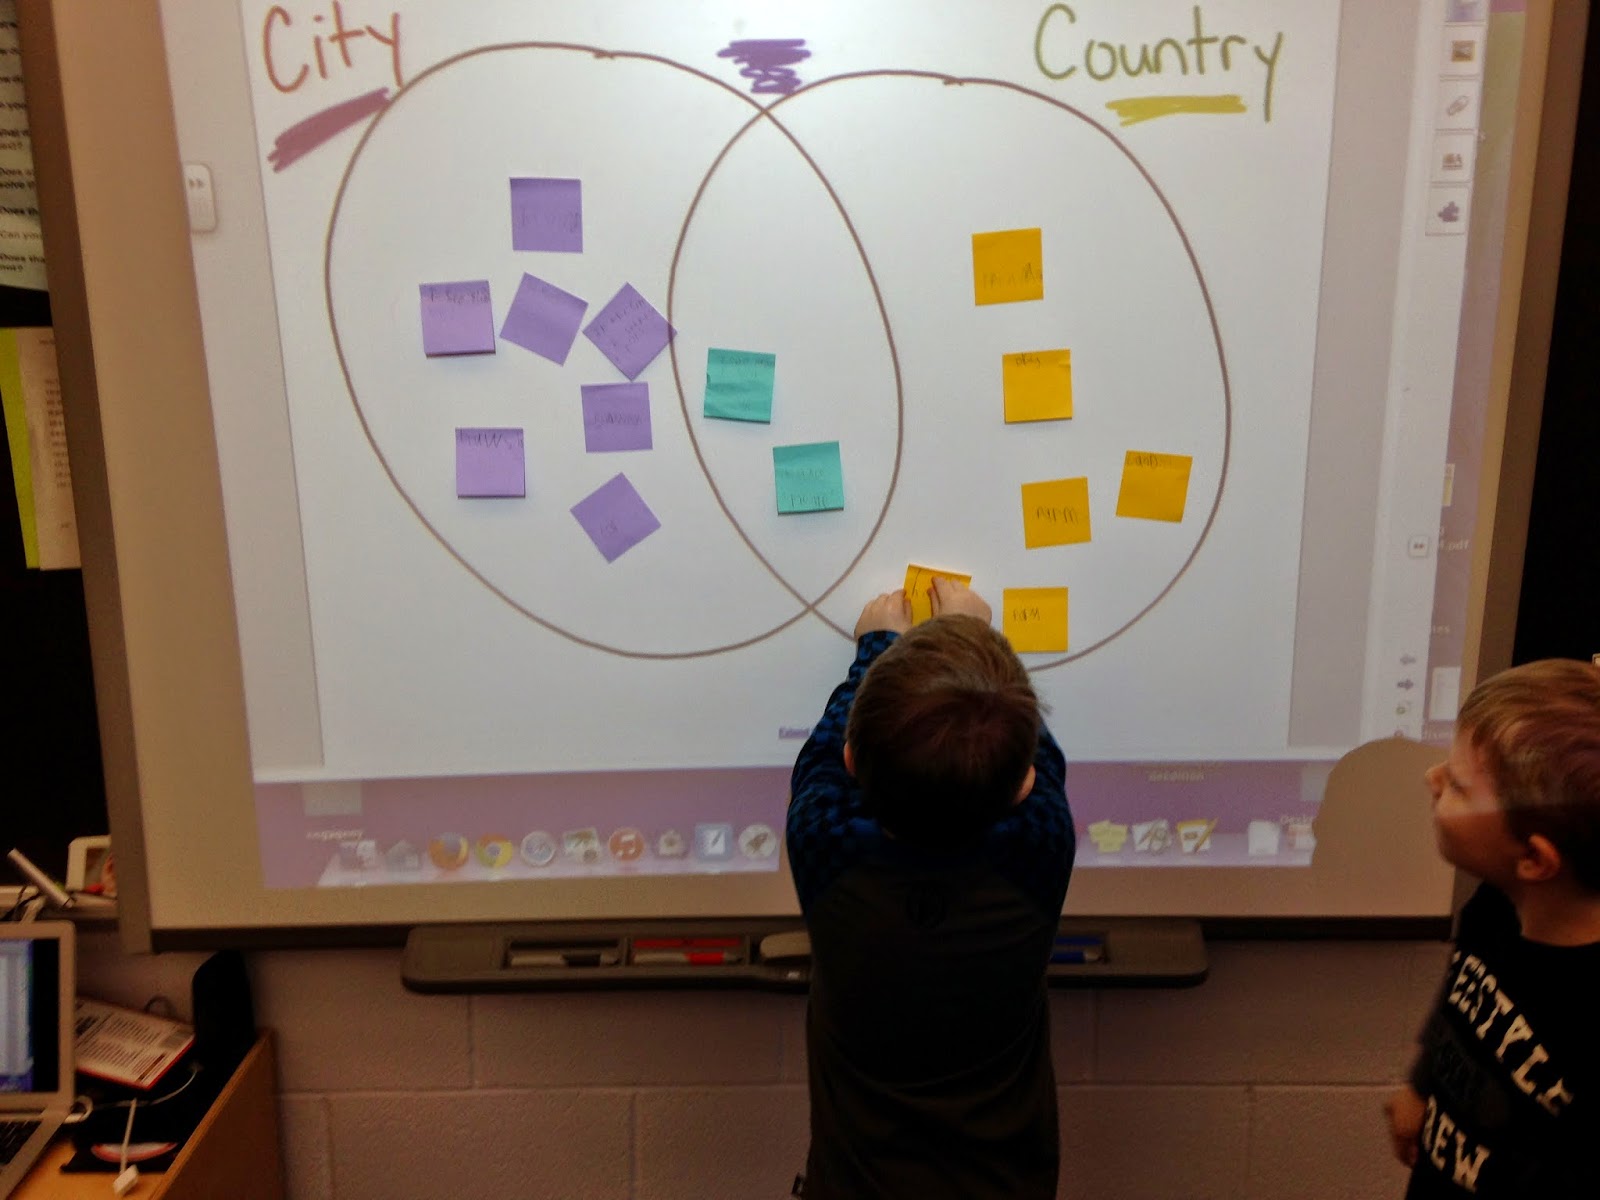
This week we began a study of city vs. country. I decided this was the perfect time to give a Venn Diagram a try.
Students started off by writing things they could find in the city/country/both on Post-Its. Each section of the Venn Diagram had a specific color of Post-It. I did this so we could see how well we sorted (a little self-assessment). Meanwhile, I drew a Venn Diagram on the SMARTboard. My kiddos were seated in groups of 4-5 and were encouraged to chat before writing on/posting Post-Its.
Students brought their Post-Its up as they wrote characteristics of each place.
After about 5 minutes of posting Post-Its, we came back together as a group. We looked at each Post-It and grouped the ones that were the same. We then discussed whether or not that is where the Post-Its actually belong. Once we had all the Post-Its where they belonged, we could easily see how well we did sorting the characteristics.
My kiddos loved this activity, and it was an easy way for them to sort the information. I'm looking forward to using more graphic organizers in my classroom in the future!


No comments:
Post a Comment